> ## Documentation Index
> Fetch the complete documentation index at: https://skybridge-staging-ecom-template.mintlify.site/llms.txt
> Use this file to discover all available pages before exploring further.
# DevTools
> Call tools and render views locally, without a host
Testing through a real host means exposing a public URL, registering a connector, starting a conversation, and prompting the model until it calls the right [tool](/build/tools). DevTools cuts that loop down to a file save: it runs locally, emulates the host runtime, and lets you call tools directly, no model or host involved.
## Start the Emulator
DevTools ships with the dev server. In a [scaffolded](/get-started/quickstart#scaffold-your-project) project, start it from the project root:
```bash npm theme={null}
npm run dev
```
```bash pnpm theme={null}
pnpm dev
```
```bash yarn theme={null}
yarn dev
```
```bash bun theme={null}
bun dev
```
```bash deno theme={null}
deno task dev
```
Two routes come up:
* `http://localhost:3000/mcp`: your MCP server
* `http://localhost:3000/`: the DevTools
Every [tool](/build/tools) registered on the server appears in the sidebar automatically, and edits to the server or the [views](/build/view) reload the preview on save.
## Explore the Features
Select a tool in the sidebar and DevTools gives you the full exchange:
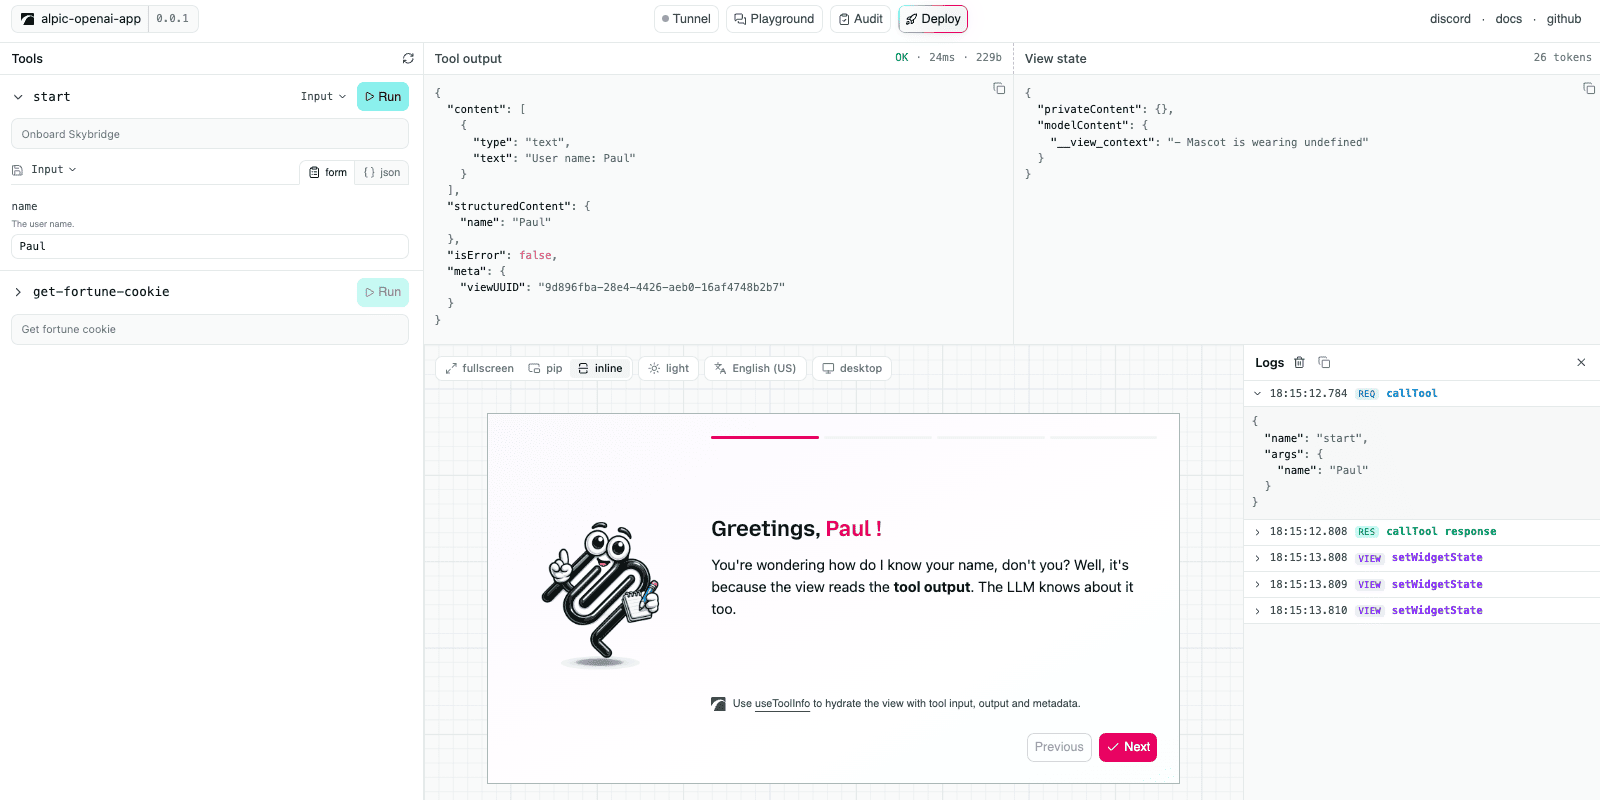 * **Tool controls**: generated from the tool's [input schema](/api-reference/register-tool#inputschema-outputschema). Inputs can be saved and re-run from the tool header.
* **Tool output**: the raw server [response](/api-reference/register-tool#return) (`content`, `structuredContent`, `_meta`), with status, latency, and payload size.
* **State inspector**: the view [state](/build/state) as a JSON tree, updated as the view mutates it.
* **View preview**: the rendered [View](/build/view), with live controls to switch [display mode](/api-reference/use-display-mode#displaymode), theme, locale, and device type; the preview updates immediately.
* **Call logs**: every runtime API call the view makes (`setViewState`, `callTool`, `requestDisplayMode`) with its arguments and responses.
## Drive DevTools from a Coding Agent
DevTools exposes its actions as [WebMCP](https://github.com/webmachinelearning/webmcp) tools, so a coding agent that drives your browser runs them directly. The agent connects through [chrome-devtools-mcp](https://github.com/ChromeDevTools/chrome-devtools-mcp), an MCP server that discovers and calls a page's WebMCP tools. On the DevTools page it can:
* **Run any registered tool** and render its view in the preview.
* **Read the rendered view** by screenshotting the preview, then drive it as a real page.
* **Switch the preview controls**: display mode, theme, locale, and device.
### Set It Up
Register the MCP server with the WebMCP flag, forwarding the browser feature flag to the Chrome it launches.
```bash theme={null}
claude mcp add chrome-devtools --scope user -- \
npx chrome-devtools-mcp@latest \
--categoryExperimentalWebmcp=true \
--chrome-arg=--enable-features=WebMCP,DevToolsWebMCPSupport
```
```bash theme={null}
codex mcp add chrome-devtools -- \
npx chrome-devtools-mcp@latest \
--categoryExperimentalWebmcp=true \
--chrome-arg=--enable-features=WebMCP,DevToolsWebMCPSupport
```
[](https://cursor.com/en/install-mcp?name=chrome-devtools\&config=eyJjb21tYW5kIjoibnB4IiwiYXJncyI6WyIteSIsImNocm9tZS1kZXZ0b29scy1tY3BAbGF0ZXN0IiwiLS1jYXRlZ29yeUV4cGVyaW1lbnRhbFdlYm1jcD10cnVlIiwiLS1jaHJvbWUtYXJnPS0tZW5hYmxlLWZlYXR1cmVzPVdlYk1DUCxEZXZUb29sc1dlYk1DUFN1cHBvcnQiXX0=)
See the [client configuration guide](https://github.com/ChromeDevTools/chrome-devtools-mcp#mcp-client-configuration), or add this to your MCP config:
```json mcp.json theme={null}
{
"mcpServers": {
"chrome-devtools": {
"command": "npx",
"args": [
"-y",
"chrome-devtools-mcp@latest",
"--categoryExperimentalWebmcp=true",
"--chrome-arg=--enable-features=WebMCP,DevToolsWebMCPSupport"
]
}
}
}
```
Run `npm run dev` and open the DevTools URL printed in the terminal.
Open the app in DevTools with chrome-devtools-mcp, list its WebMCP tools, call one with sample input, and screenshot the preview to check the view renders.
Your agent now closes its own loop: it edits a view, runs the tool, reads the rendered result, and fixes what is wrong.
WebMCP is experimental and supported Chrome version 149 or newer.
## Authenticated Servers
When your server [requires OAuth](/build/auth), DevTools registers itself through Dynamic Client Registration on first connect and walks the full PKCE flow as a public client. A server that needs a pre-registered client or a different grant type won't connect from DevTools.
DevTools caches the authorization within the browser, so later sessions reconnect without prompting. To clear a cached registration, click **Sign out** in the header.
## Limitations
DevTools emulates, and three gaps separate the emulation from production:
* **No model**: you pick the [tool](/build/tools) and type the arguments yourself. Tool selection, the prompt surface (names, descriptions, schemas), and follow-up messages are never exercised.
* **One runtime**: as of today the preview mocks the [Apps SDK runtime](/resources/apps-sdk-and-mcp-apps#apps-sdk). [MCP Apps](/resources/apps-sdk-and-mcp-apps#mcp-apps)-specific features are not yet supported.
* **Loose [CSP](/guides/csp)**: external resources blocked by hosts in production may load locally.
To test your app against a real LLM, use the [playground](/test/playground) or connect your server to ChatGPT or Claude using the [tunnel](/test/tunnel).
## Go Further
Expose your local server to real hosts
Chat with a real model running your app
Catch spec and platform issues before submission
* **Tool controls**: generated from the tool's [input schema](/api-reference/register-tool#inputschema-outputschema). Inputs can be saved and re-run from the tool header.
* **Tool output**: the raw server [response](/api-reference/register-tool#return) (`content`, `structuredContent`, `_meta`), with status, latency, and payload size.
* **State inspector**: the view [state](/build/state) as a JSON tree, updated as the view mutates it.
* **View preview**: the rendered [View](/build/view), with live controls to switch [display mode](/api-reference/use-display-mode#displaymode), theme, locale, and device type; the preview updates immediately.
* **Call logs**: every runtime API call the view makes (`setViewState`, `callTool`, `requestDisplayMode`) with its arguments and responses.
## Drive DevTools from a Coding Agent
DevTools exposes its actions as [WebMCP](https://github.com/webmachinelearning/webmcp) tools, so a coding agent that drives your browser runs them directly. The agent connects through [chrome-devtools-mcp](https://github.com/ChromeDevTools/chrome-devtools-mcp), an MCP server that discovers and calls a page's WebMCP tools. On the DevTools page it can:
* **Run any registered tool** and render its view in the preview.
* **Read the rendered view** by screenshotting the preview, then drive it as a real page.
* **Switch the preview controls**: display mode, theme, locale, and device.
### Set It Up
Register the MCP server with the WebMCP flag, forwarding the browser feature flag to the Chrome it launches.
```bash theme={null}
claude mcp add chrome-devtools --scope user -- \
npx chrome-devtools-mcp@latest \
--categoryExperimentalWebmcp=true \
--chrome-arg=--enable-features=WebMCP,DevToolsWebMCPSupport
```
```bash theme={null}
codex mcp add chrome-devtools -- \
npx chrome-devtools-mcp@latest \
--categoryExperimentalWebmcp=true \
--chrome-arg=--enable-features=WebMCP,DevToolsWebMCPSupport
```
[](https://cursor.com/en/install-mcp?name=chrome-devtools\&config=eyJjb21tYW5kIjoibnB4IiwiYXJncyI6WyIteSIsImNocm9tZS1kZXZ0b29scy1tY3BAbGF0ZXN0IiwiLS1jYXRlZ29yeUV4cGVyaW1lbnRhbFdlYm1jcD10cnVlIiwiLS1jaHJvbWUtYXJnPS0tZW5hYmxlLWZlYXR1cmVzPVdlYk1DUCxEZXZUb29sc1dlYk1DUFN1cHBvcnQiXX0=)
See the [client configuration guide](https://github.com/ChromeDevTools/chrome-devtools-mcp#mcp-client-configuration), or add this to your MCP config:
```json mcp.json theme={null}
{
"mcpServers": {
"chrome-devtools": {
"command": "npx",
"args": [
"-y",
"chrome-devtools-mcp@latest",
"--categoryExperimentalWebmcp=true",
"--chrome-arg=--enable-features=WebMCP,DevToolsWebMCPSupport"
]
}
}
}
```
Run `npm run dev` and open the DevTools URL printed in the terminal.
Open the app in DevTools with chrome-devtools-mcp, list its WebMCP tools, call one with sample input, and screenshot the preview to check the view renders.
Your agent now closes its own loop: it edits a view, runs the tool, reads the rendered result, and fixes what is wrong.
WebMCP is experimental and supported Chrome version 149 or newer.
## Authenticated Servers
When your server [requires OAuth](/build/auth), DevTools registers itself through Dynamic Client Registration on first connect and walks the full PKCE flow as a public client. A server that needs a pre-registered client or a different grant type won't connect from DevTools.
DevTools caches the authorization within the browser, so later sessions reconnect without prompting. To clear a cached registration, click **Sign out** in the header.
## Limitations
DevTools emulates, and three gaps separate the emulation from production:
* **No model**: you pick the [tool](/build/tools) and type the arguments yourself. Tool selection, the prompt surface (names, descriptions, schemas), and follow-up messages are never exercised.
* **One runtime**: as of today the preview mocks the [Apps SDK runtime](/resources/apps-sdk-and-mcp-apps#apps-sdk). [MCP Apps](/resources/apps-sdk-and-mcp-apps#mcp-apps)-specific features are not yet supported.
* **Loose [CSP](/guides/csp)**: external resources blocked by hosts in production may load locally.
To test your app against a real LLM, use the [playground](/test/playground) or connect your server to ChatGPT or Claude using the [tunnel](/test/tunnel).
## Go Further
Expose your local server to real hosts
Chat with a real model running your app
Catch spec and platform issues before submission